There is a huge push for student data in the classroom. And, I LOVE it! If you haven't already gotten on the bandwagon; or if you have not really liked the way you have been using data in your classroom, this is the blog for you!
Each student in my class has their own data folder (this school year, I think we might try to get enough binders). We keep district data, and classroom data in them. The students graph everything themselves. After the initial making, or acquiring of, materials for the binders, the students become much more self-sufficient when it comes to testing. This is especially so in district data.
What is district data? My school takes two tests in the fall, winter and spring. One of them is the NWEA(MAP) test, for multiple subjects, and a second is Fountas and Pinnell leveling for reading. To see how we graph MAP and F&P, check out my Teachers Pay Teachers store by clicking here. Once I initially teach the students to use the graphs and binder the students can look up their own scores, tell their scores to others, and graph their new scores! I never have to look up old scores.....they do it themselves!
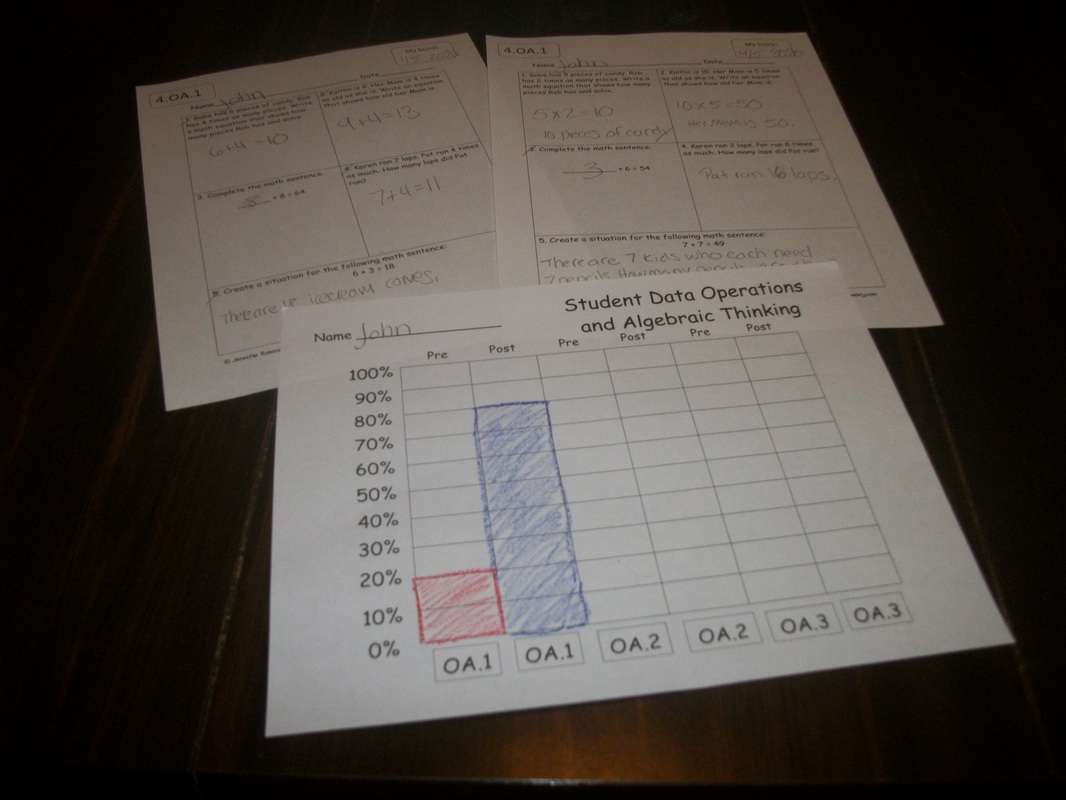
What sort of classroom data do I use? I LOVE pre and post testing students! They also love it, because they can see their own growth. The data binders give the students learning that they can hold in their hands and show to others! An example of classroom data is shown below. In math workshop (we are now fully using Common Core in my school) we pre-test and post-test for all of the standards. After seeing their results, the students then can mark in their own scores for their data binders! Click on the picture to go to my TpT store to see the 4th grade Common Core Math Assessments or the Student Data Graphing for 4th grade.
Each student in my class has their own data folder (this school year, I think we might try to get enough binders). We keep district data, and classroom data in them. The students graph everything themselves. After the initial making, or acquiring of, materials for the binders, the students become much more self-sufficient when it comes to testing. This is especially so in district data.
What is district data? My school takes two tests in the fall, winter and spring. One of them is the NWEA(MAP) test, for multiple subjects, and a second is Fountas and Pinnell leveling for reading. To see how we graph MAP and F&P, check out my Teachers Pay Teachers store by clicking here. Once I initially teach the students to use the graphs and binder the students can look up their own scores, tell their scores to others, and graph their new scores! I never have to look up old scores.....they do it themselves!
What sort of classroom data do I use? I LOVE pre and post testing students! They also love it, because they can see their own growth. The data binders give the students learning that they can hold in their hands and show to others! An example of classroom data is shown below. In math workshop (we are now fully using Common Core in my school) we pre-test and post-test for all of the standards. After seeing their results, the students then can mark in their own scores for their data binders! Click on the picture to go to my TpT store to see the 4th grade Common Core Math Assessments or the Student Data Graphing for 4th grade.
I am constantly on the look out for more meaningful data to add to our classroom data binders; I'm sure this is a subject that will be revisited again soon.....

 RSS Feed